
Augmented Qualitative Analysis (AQA)
I first started working on the semi-automated construction of Causal Loop Diagrams (CLDs) as part of a process of qualitative analysis for my MBA project. This work was developed into a full paper and published in the European Journal of Operational Research in 2013.
Yearworth, M., & White, L. (2013). The Uses of Qualitative Data in Multimethodology: Developing Causal Loop Diagrams During the Coding Process. European Journal of Operational Research, 231(1), 151-161. https://doi.org/10.1016/j.ejor.2013.05.002 [post-print version]
Judging by the citations, the methodology described in this paper has been used to develop CLDs across a wide range of application areas.
At the time of writing, the methodology was supported by the use of conventional Computer Aided Qualitative Data Analysis Software (CAQDAS) and, specifically, the use of matrix queries to compute the number of times pairs of concepts (codes) are related by the fact that they co-code paragraphs of text in the sources. The resulting adjacency matrix could be interpreted as a preliminary CLD and an input to further analysis.
Since then, the emergence of probabilistic topic modelling based on the Latent Dirichlet allocation (LDA) means that it is now possible to automate the coding process for very large collections of documents (hundreds to thousands), comprising millions to hundreds of millions of words. The co-coding technique described in Yearworth and White (2013) can be similarly applied by feeding the corpus into the topic model and counting and thresholding the resultant classification of paragraphs by topic(s). This process still requires an inductive1 bridge – in deciding i) a meaningful number of topics (k) to be used for the topic model, ii) the labelling of the topics based on an exploration of the term lists and a re-reading of the text coded by each topic, and iii) a decision about the meaning of the links – can they be interpreted as causal? In practice the last two processes are bound together and interactive once a topic model of particular size has been chosen.
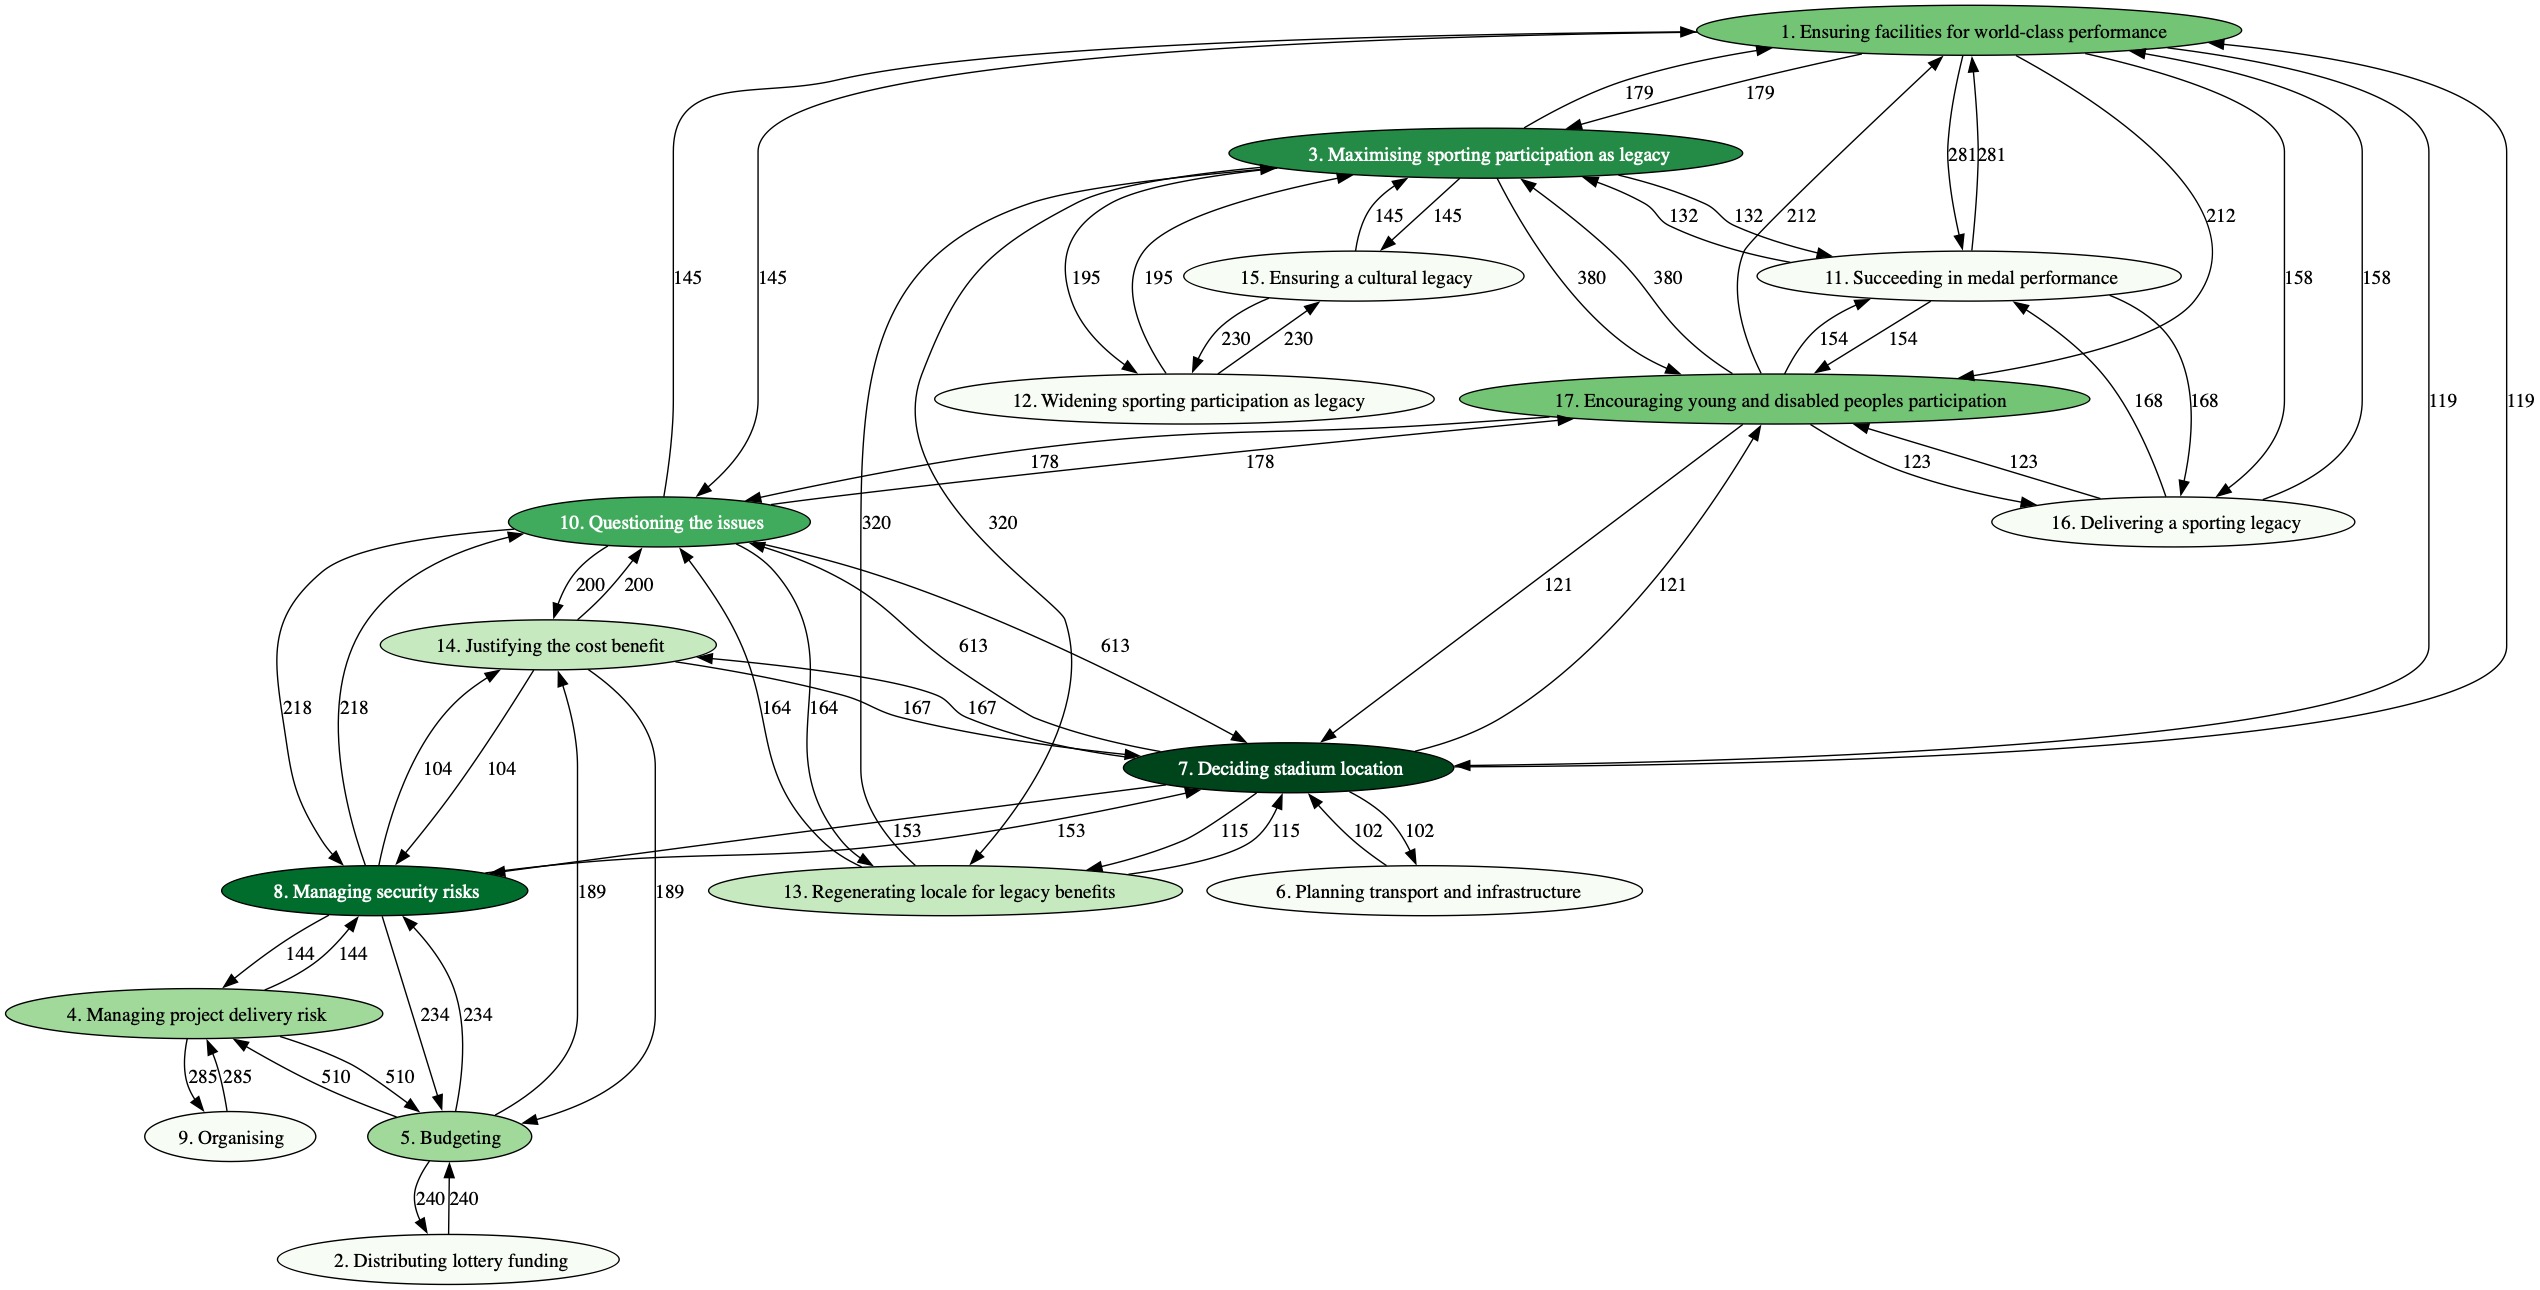
An example graph is shown below based on a corpus of documents assembled from archival material about the 2012 London Olympic Games. The corpus is relatively small for a machine learning technique, 170 documents and just over a million words. However, this is of the sort of volume of data that is starting to get beyond the abilities of a single qualitative researcher to analyse. I’ve called this territory a hinterland for qualitative analysis and hence the motivation for an augmented approach. The graph presented here has been coloured according to betweenness centrality.
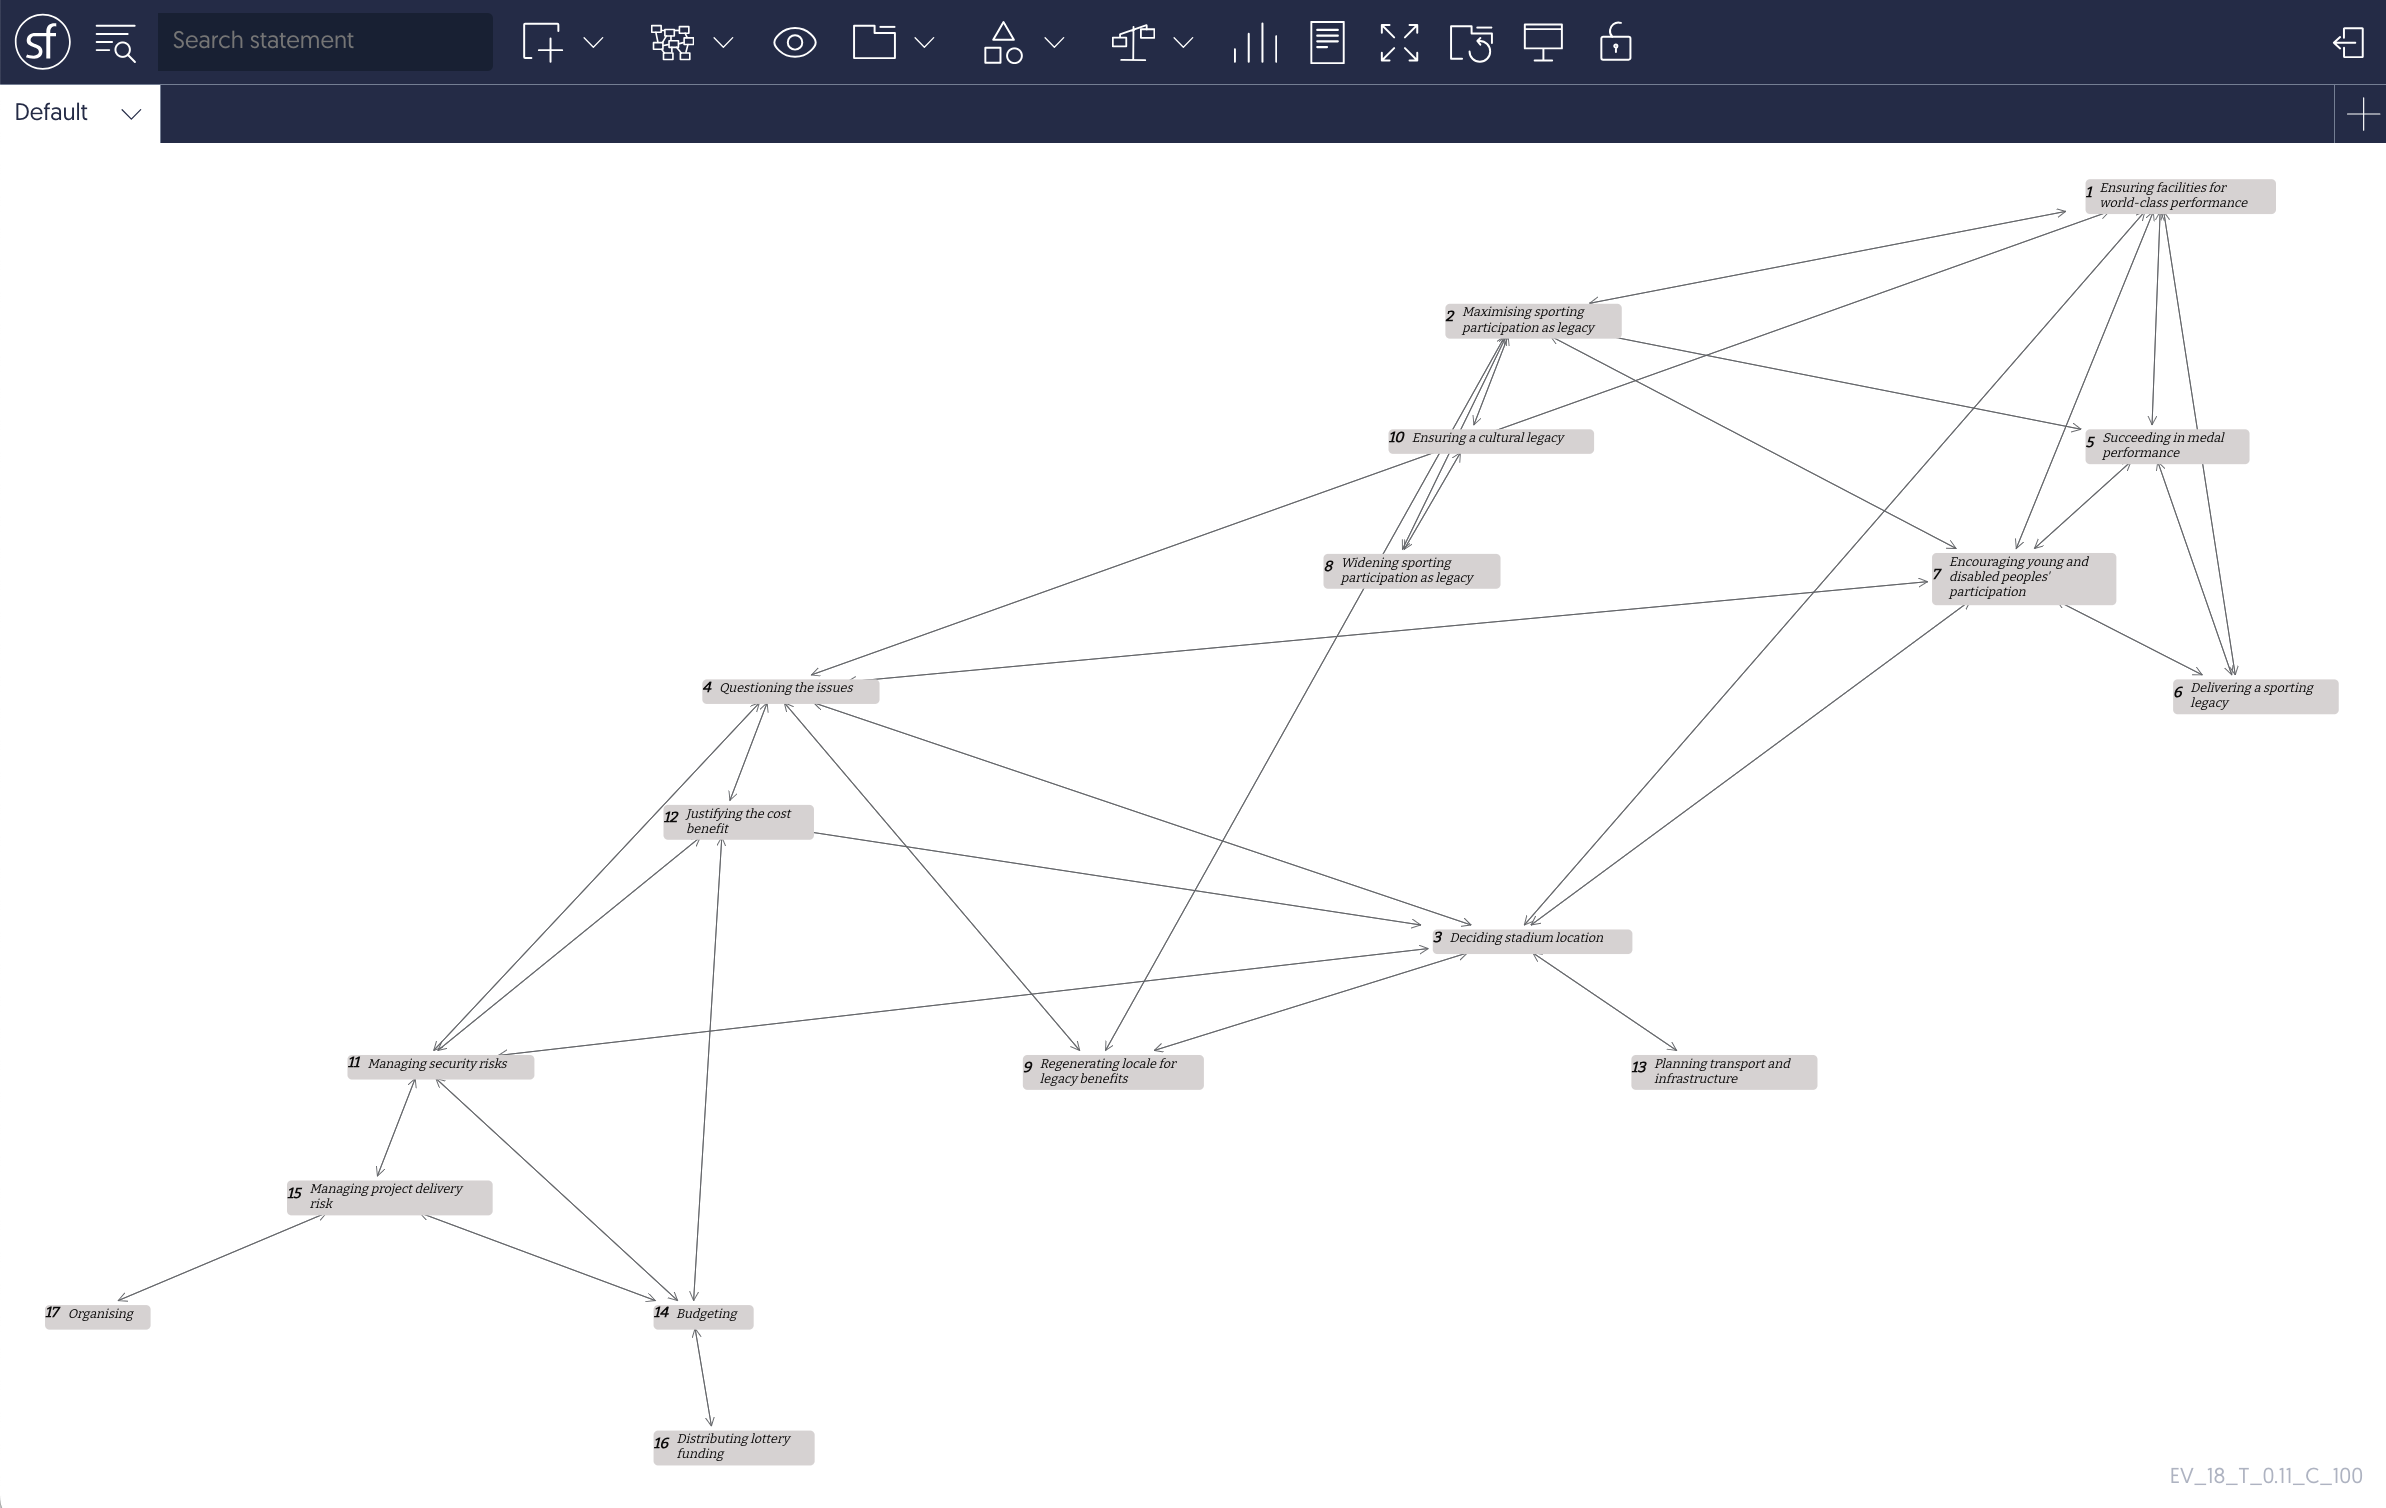
The graph was automatically translated into the JSON format supported by the Strategyfinder platform and is shown as a potential causal map below. Once imported into Strategyfinder it is then a further process to discuss the meaning of the relationship between statements i.e., the nature of the links, whether they represent a causal relationship, and their directionality. An export filter to create MDL files suitable for import into Vensim also exists.
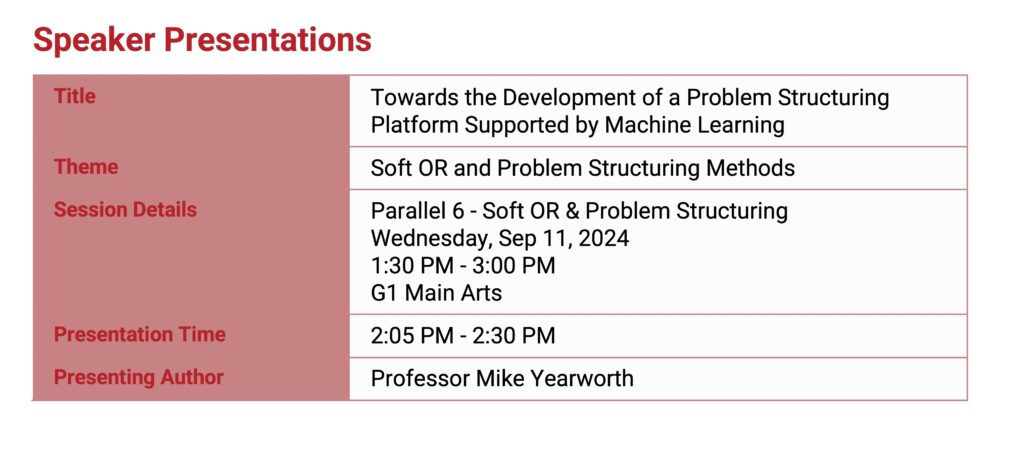
I discuss this technique further in Chapters 14 and 15 of my forthcoming book Problem Structuring : Methodology in Practice in the context of a deployment of the technique via a problem structuring platform as a type of Group Support System (GSS). This is also the subject of my upcoming talk at OR66.

- I’ve labelled this an inductive step because at this stage in a process of problem structuring this is what it feels like you’re doing. However, situated inside a wider problem structuring process loop that includes modelling and taking action then it could be considered as abductive reasoning. ↩︎